OPTIMUM SCOUTING
FOOTBALL SCOUTING CONSULTING
One month ago, I finished a study on Year 1 to Year 2 quarterback development since 2011 and used those findings to project the 2018 quarterback class’ sophomore season in the NFL. After finding the average difference between Year 1 and Year 2, each 2018 rookie’s year was scaled to a full season and compared to the average difference. The average difference was tacked onto each player’s scaled rookie season and — voila — rudimentary quarterback projections.
Non-Weighted Year 2 Projections
While somewhat useful and entertaining, tacking on the average jump regardless of quality of Year 1 was flawed. Adding the average jump to Baker Mayfield’s rookie year, for example, spit out a stat line that looked like current-day Russell Wilson. On the other hand, only assuming average growth for Josh Rosen would make his Year 2 the worst since 2011. Maybe Mayfield can reach those heights right away and maybe Rosen will be an unprecedented disaster, but it makes more sense to weigh each rookie’s projected development by the quality of their Year 1. Additionally, ANY/A is the best bet to use as the weight scale because it is the most well-rounded statistic used in this study.
In short: players with above-average rookie seasons have less room to grow in the short-term; below-average rookies have a ton of ground to make up and can make an above-average jump while only reaching an average Year 2 overall. That premise puts a damper on good rookie quarterbacks people are eager to crown as the next elite passer, but it makes sense. Any number of factors could lend to an exceptional rookie season that regress the following year (*cough* Dak Prescott) or vice versa. It may also be the case that one player is quicker to find their bearings than another, even if they end up the same quality of player down the road. Trying to account for these things is only fair.
A few things stick out from weighting the projections. For one, touchdowns and interceptions were among the most volatile stats, so players with below-average Year 1s caught a major break there. Additionally, sacks are sticky year-to-year in this case (+0.13 average sack difference), therefore weighting sack totals changed virtually nothing. Any benefit/hindrance by way of sack totals and yardage remained about the same despite the adjustments.
So without any more rambling, here are weighted Year 2 projections for the 2018 quarterback class:

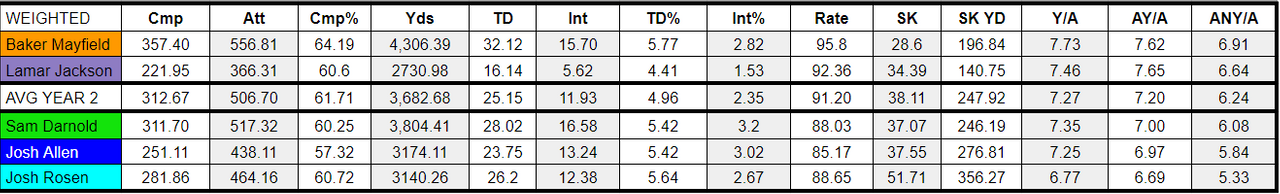
The top picture is non-weighted projections from a month ago and the bottom picture is the new weighted projections. No surprise — Rosen saw the most dramatic changes to his weighted scores.
Mayfield, despite a sizable drop, stays well ahead of his peers. Lamar Jackson took a small hit, Sam Darnold benefited from a minor boost toward average. Josh Allen’s weighted projection moves the needle most in terms of changing how these projections make him stack up. The two extremes (Mayfield, Rosen) still look extreme and the two players around the average (Jackson, Darnold) feel roughly the same quality as before. Allen, though, went from well below average to within reach. It does not drag him out of “not sure he is the guy” territory yet, but there is a smidgen more hope that he can find his way.
Now, let's take a closer look at each player’s weighted projections and how they compare to the previous projections, as well as where their new projections would have ranked in 2018.
(34 quarterbacks qualified with at least six starts in 2018)

Passer Rating Change: -5.95
ANY/A Change: -0.55
Weighted Y2 Passer Rating Rank: 16/34
Weighted Y2 ANY/A Rank: 12/34
Mayfield’s weighted projections are not nearly as gaudy as before, but he remains primed to be an above-average quarterback. His ANY/A is slightly higher than Carson Wentz and Deshaun Watson’ last season, just barely below Andrew Luck and Aaron Rodgers.
There is also room for cut down on interceptions in a way the projections are not showing. Per Football Outsiders, Mayfield was the unluckiest passer in the league (at least among returning starters) with regards to being intercepted on passes he didn’t deserve to. He threw 3.2 interceptions over expectation. It is plausible his rookie interception total was inflated, which bodes poorly for his weighted projections that expect little improvement in that department. If Mayfield sees a swing in fortune, he could clear an already impressive bar set by his projections.

Passer Rating Change: -2.02
ANY/A Change: -0.25
Weighted Y2 Passer Rating Rank: 22/34
Weighted Y2 ANY/A Rank: 16/34
The caveat with Jackson is unchanged: his efficiency is solid, but he has to put up more volume. Jackson was used as a runner at an unrepeatable clip as a rookie, while his passing was brought along slowly and in light volume. Running can and should be part of Jackson’s game, but he needs to take on a heavier burden as a passer to validate his first-round status. He must take command of the passing offense and better orchestrate long, steady drives.
In fairness, Jackson’s freshman season at Louisville was a high-variance affair, too. The highs were high because he had a phenomenal arm and punishing speed, but he was not ready to operate the offense on a down-to-down basis. He made stunning strides as a sophomore, demanding the attention of a nation on his way to winning the Heisman trophy. Jackson’s electrifying plays were instrumental to his success, but he took a noticeable step forward in his progressions, accuracy, and decision making.
More promising is how Jackson’s projected efficiency stacks up to his peers since 2011. Jackson’s 6.64 ANY/A would be nearly identical to Cam Newton’s 6.65 in 2012. Newton is a superior talent and an unreasonable standard for Jackson long-term, but if he can match Newton’s early production, that is as encouraging a sign as any that Jackson is well on his way.

Passer Rating Change: +1.06
ANY/A Change: 0.09
Weighted Y2 Passer Rating Rank: 27/34
Weighted Y2 ANY/A Rank: 23/34
Adjusting projections did the least for Darnold. He made slight gains that are certainly welcome, but do little to change the narrative. Like the last batch of projections, Darnold is a hair below average in terms of efficiency and slightly above in volume.
At 6.08 ANY/A, Darnold’s projected Year 2 is almost identical to Blake Bortles’ (6.09) and Andrew Luck’s (6.06). Furthermore, his rate of progression is not so different from Luck’s. Bortles reached his Year 2 heights largely off of an unsustainable touchdown rate, an unreal season from wide receiver Allen Robinson, and a fair amount of garbage-time production. He jumped 2.28 ANY/A from his rookie year, one of the largest jumps since 2011. Luck, on the other hand, made modest progression from 5.66 to 6.06, good for a +0.40 difference. Darnold’s +0.84 increase from 5.24 to 6.08 would be better than Luck’s, but still far more comparable than to Bortles’ miracle year.

Passer Rating Change: +6.77
ANY/A Change: +0.58
Weighted Y2 Passer Rating Rank: 28/34
Weighted Y2 ANY/A Rank: 26/34
Allen is perhaps the most interesting of the bunch. His non-weighted projections had him at 5.26, worse than Rosen’s weighted projections now. It wasn’t pretty. When adjusting for his Year 1, Allen’s projections and progress are more favorable. 5.84 ANY/A sandwiches his Year 2 between Dak Prescott (5.74) and Jameis Winston (5.98) — not elite company, but there are far worse peers to be compared to.
Rate of progression may be a more fitting indicator of where Allen is heading, though. Allen’s Year 1 to Year 2 jump is set at +1.47 ANY/A. Derek Carr (+1.49) and Mitchell Trubisky (+1.54) are the closest to that mark. The Carr parallel doesn’t work well because the two have vastly different play styles and the avenues with which they put up their rookie numbers aren’t comparable.
Trubisky is a more apt comparison to draw. Allen and Trubisky are both scattershot, inconsistent in their mental processing, comfortable outside the pocket and amidst chaos, and pose as running threats. They are not carbon copies of each other, but they win in similar fashion. Allen is a less effective player overall, but for him to follow a similar development arc, especially given how much the Bills invested into their offense this offseason, would not be surprising.

Passer Rating Change: +12.11
ANY/A Change: +0.96
Weighted Y2 Passer Rating Rank: 27/34
Weighted Y2 ANY/A Rank: 30/34
Intuition tells us Rosen benefits the most from a numbers perspective by weighted projections. His rookie season was a disaster and that earns him a significant boost to skew closer to the average Year 2. More than the numbers alone, Rosen’s image is also somewhat saved by these new projections.
If we assumed Rosen would only make average progress without accounting for how poor his Year 1 was, he would only reach 4.37 ANY/A next season. That would be the worst Year 2 ANY/A since 2011, well out of reach of Blaine Gabbert’s 4.71. It’s possible Rosen is that bad. After all, someone has to be. But he was thrown into an all-time bad offense with a set of revolving doors in place of a coaching staff. There is reason to believe he caught the short end of the stick more so than he is a legitimately bad player.
Of course, climbing to 5.33 ANY/A through the weighted projections still earns him one of the worst Year 2 ANY/A totals since 2011. Rosen’s projected Year 2 is worse than Robert Griffin’s (5.48) and Andy Dalton’s (5.68) sophomore seasons in the NFL, and only marginally better than Geno Smith’s (5.13). He is far from making good on his 10th-overall draft slot, but the weighted projections at least grant him some benefit of doubt moving forward, rather than doom him as one of the worst quarterback selections this decade.