OPTIMUM SCOUTING
FOOTBALL SCOUTING CONSULTING

Rookie seasons are a crap shoot for quarterbacks. With as fragile as the position is, situation is everything in making sure a young quarterback does not implode. A fantastic situation will not necessarily make them a star right away because the learning curve is so steep, but a poor situation will leave a rookie feeling like they’ve been tied to a boulder and thrown into the ocean.
Come Year 2, however, teams have likely been able to do more to help their young quarterback out. Whether it is offensive line upgrades, receiver help, or consistency or a clear up at offensive coordinator, teams typically want to do right by their young quarterbacks and give them a chance to prove themselves. Their situations stabilize, they adjust to the speed of the NFL, and they start to show real signs of how capable they are as NFL quarterbacks.
With that, Year 2 quarterbacks can be expected to improve a fair amount and start to settle in around league average. The question is how much a rookie should reasonably be expected to improve in just one year. To answer that question, I took a look at Year 1 to Year 2 jumps for every relevant rookie quarterback since 2011. 2011 is the best cutoff point for analyzing recent quarterback classes because that was when the CBA made changes to practices and offseason schedules.
To make the sample more consistent, only quarterbacks who started at least six games in each of their first two seasons were counted, qualifying 20 quarterbacks. Each of the 20 quarterbacks’ two seasons were then averaged separately and normalized to a 16-game sample (because not every player played 16 games) to compare the average jump from Year 1 to Year 2.


We can then use those numbers to project what the 2018 draft class may look like in Year 2. By taking the average difference in volume stats (comp., att., yards, TD, INT), adding them to each player’s rookie stats, and calculating their efficiency stats manually (comp %, ANY/A, passer rating), we can get a rough estimate of how well each 2018 quarterback should be expected to play.
These projections can tell us two things. First, the projection of where a player’s expected efficiency numbers, namely ANY/A and passer rating, are compared to an average Year 2 can give us an idea of where they were as a rookie against how much they need to progress to be on track with an average Year 2.
Second, each players’ projection can be used not necessarily as a hard expectation for their level of play, but a baseline they should look to clear in order to suggest they are at least trending in the right direction. For the players with particularly poor rookie seasons, this is especially true.

Above is each quarterback's projected second season stacked against one another and sorted by ANY/A, with the average Year 2 break in the middle to separate the "good" from the "bad."

It is no surprise Cleveland’s Baker Mayfield sports a great projected stat line. However, it is not so much impressive because he dwarfs his 2018 peers, it is that his projected stat line would rank among the league’s elite. For example, Mayfield’s 7.46 ANY/A and 101.75 passer rating would have ranked 7th and 8th, respectively, in the league last year. The closest player to matching both marks last year was Rams quarterback Jared Goff, a third-year quarterback who helped lead his team to the Super Bowl. Furthermore, among all qualifying Year 2 quarterbacks since 2011, Mayfield would rank 3rd and 4th in those same areas, respectively.
Mayfield’s projections are lofty, but with as well as he played last year now being amplified by the addition of wide receiver Odell Beckham Jr., it does not feel farfetched.

The only other 2018 quarterback projected to an above average Year 2 is Baltimore’s Lamar Jackson, but even he comes with a caveat. Strictly in terms of efficiency, Jackson passes the test with flying colors. His 6.98 ANY/A and 94.38 passer rating are comfortably above average for Year 2 QBs, and his interception rate would be lowest in class by far.
The problem is volume. It is not for lack of only starting seven games last year, either. This trial normalized each season to 16 games and projected their Year 2 based off of that. In other words, Jackson’s passing volume is low because of his per-game usage, not because he played a shortened season. Assuming Jackson only experiences the expected amount of volume increase, his Year 2 would end up almost 900 yards and about 7.5 touchdowns below average. The efficiency numbers are encouraging, but volume still matters and Jackson will need to take on more of the burden than his projections suggest he will.

New York’s Sam Darnold is the median of the 2018 class and the closest to projecting to an average Year 2. His 5.99 ANY/A and 86.97 are both a smidge below average, but not so much so that it should draw major concern. The three most comparable Year 2s for Darnold’s primary efficiency stats are Andrew Luck (6.06, 87.0), Jameis Winston (5.98, 86.1), and Blake Bortles (6.09, 88.2). Darnold received comparisons to all three players coming out of college, so it is only fitting that they represent his most likely outcomes for his second pro season.
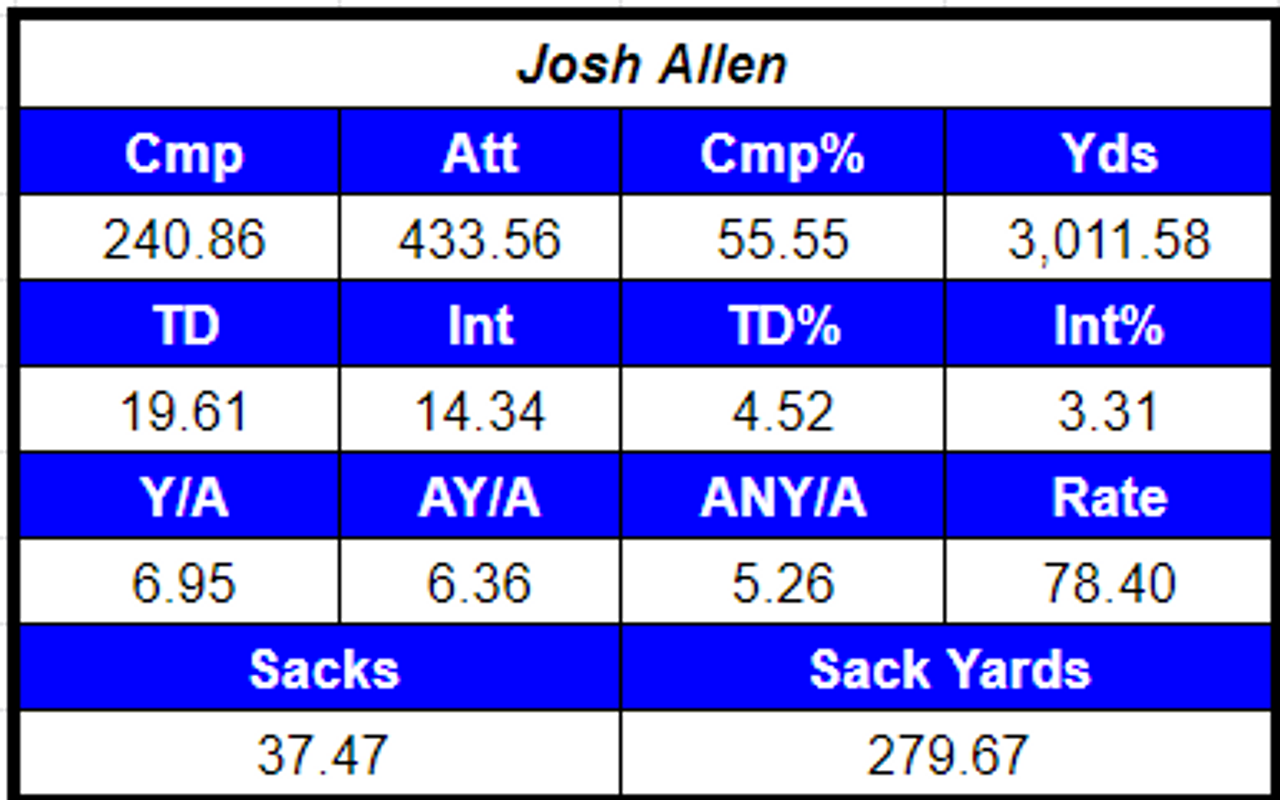

The remaining two quarterbacks in Buffalo’s Josh Allen and Miami’s Josh Rosen can be grouped together. Both are well below average in efficiency and do not even beat Jackson by much in terms of volume for yardage and touchdowns. By passer rating, the two Josh's are nearly identical, with Allen’s 78.40 just barely edging out Rosen’s 76.54. The difference is Rosen’s significantly lower ANY/A, but that is almost solely because of the amount of sacks he took last year and how many times the numbers projected him to be sacked next year.
Sacks were the stickiest stat of all in this test. The difference between Year 1 sack totals and Year 2 was an increase of just 0.13 sacks, which makes for an ever-so-slightly lower sack rate given the increase in passing attempts. In turn, the projections assume Rosen will be sacked around 50 times again, but considering how decimated Arizona’s offensive line was and Rosen now getting a new opportunity in Miami, Rosen’s sack total feels like a good candidate to stray from the projections. Hopefully his sack total can skew closer to the mid-30s range with everyone else to make his projections more comparable to Allen’s.
If Rosen’s sack fortune does not turn, however, he will be in for the worst recorded Year 2 since 2011. His projected 4.37 ANY/A is worse than Blaine Gabbert’s 4.71 ANY/A in 2012 and would make Rosen the only quarterback alongside Gabbert to score below 5.00 in ANY/A. Unless he takes a massive step forward, Rosen’s outlook is gloom.
To reiterate, these projections should not necessarily be taken as concrete predictions, but rather a bar set for each quarterback to clear. For the likes of Allen and Rosen, the bar is so low that we could assume that if they do not clear them in 2019, it may already be time to move on. For Darnold and Jackson, with them being closer to average, their bars are fairly attainable, and clearing them should make their respective teams feel comfortable moving forward with them, but failing to hit them would not be the end of the world. Mayfield is the outlier in that his bar is so high, he could fall short of it and still end up producing the best season among his 2018 class peers, while reaching or surpassing his projections would put him in special territory.